
Aggregate Demand
Aggregate demand is the total quantity of goods and services demanded by all households, all firms, government and foreign sector in a year. It is the sum of consumption, investment, government expenditure and net exports. It is also called aggregate expenditure or aggregate spending. Therefore, AD represents the total spending on all domestic final goods and services in a year.

Remember that all of these components of AD are also the components of GDP. To know more about GDP read the article GDP and its Components with Example.
Components of Aggregate Demand
There are four components of aggregate demand.
- Consumption demand
- Investment demand
- Government expenditure
- Net Exports
Consumption Demand
Consumption demand refers to the demand for final goods and services by all households in the economy. Consumption is the largest component of AD. In modern developed economies it is about 60% of the total production. Disposable income (Income after direct taxes) is the most important factor that determines consumption demand. If the disposable income of the households increase (decrease), consumption is also expected to increase (decrease). So, there is a direct relationship between consumption and disposable income.
Investment Demand
Investment is the most volatile component of AD. Investment is the expenditure on non-residential structure like machines, buildings and tools etc., residential structure like new homes and apartments etc. and inventories. Investment decisions largely depend on two things, the interest rate which is the cost of borrowing the capital and the expected future return on that investment. Investment is profitable if interest rate is less than expected returns.
Government Demand
Government spending can be considered as an autonomous expenditure. Expenditures that do not respond in any systematic way with identifiable economic determinants, such as interest rate changes or income changes, are said to be autonomous. The reasoning is that government spending is primarily the result of a political decision (often considered as a policy variable), which may be largely independent of the level of national output or interest rates.
Net Exports
Net exports is the difference between exports and imports. Exports are the goods that are produced domestically and consumed by foreigners, imports are the goods produced by foreigners and consumed domestically. Thus, net exports is the net demand for domestic goods. NX will be positive if exports are greater than imports and negative if imports are greater than exports.
Key determinants of net exports are exchange rate and terms of trade. When the exchange rate increases (depreciation of currency) exports become cheaper for foreign country because now they can buy more quantity of domestic goods and services with the same amount of money. Thus, it increases exports. At the same time, imports will decrease because foreign goods now become expensive for domestic consumers. Thus, NX will increase. The opposite would be expected when exchange rate decreases.
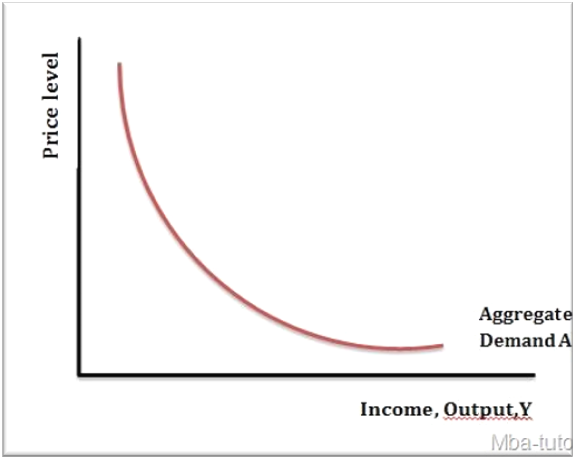
Aggregate Demand Curve
The aggregate demand curve (ADC) shows the relationship between the price level P and the total quantity of goods and services demanded Y. The aggregate demand curve slopes downward: the higher the price level P, the lower the quantity of goods and services demanded Y.
Why Aggregate Demand Curve Slopes Downward?
Aggregate demand curve slopes downward from left to right which shows negative relationship between aggregate demand and general price level. This is due to the following reasons:
- Real Balance Effect
- Interest Rate Effect
- Net Exports Effect
1. Real Balance Effect
It is also called wealth effect. The real balance effect explains how the changes in price level P affect the real purchasing power of money. If the price level increases the real value of money falls which reduces the purchasing power and consumers are able to buy fewer goods and services. Thus, as price level increases the aggregate demand for goods and services decreases.
2. Interest Rate Effect
If the price level increases people need more money to make transactions so they increase demand for money and because money supply is fixed by the central bank an increase in demand for money increases the interest rate which increases the cost of borrowing for the firms and households due to which investment and consumption expenditure in the economy decreases and thus the aggregate demand would decrease at higher price level.
3. Net Exports Effect
It is also called foreign trade effect. It occurs when changes in the price level also causes a change in foreign demand for goods. When price level increases, it has two effects:
- Lowers foreign demand of domestic goods (exports) because now exports become expensive.
- Increases domestic demand for foreign goods (imports) because now imports are relatively cheaper.
Thus, due to decrease in exports and increase in imports, the net effect would be decrease in net exports. Since net exports is the component of AD thus, AD lowers at higher price level. The opposite will happen if price level falls i.e. AD increases.
In this way due to these reasons ADC slopes downward.
Individual and Aggregate Demand Curve
Individual Demand Curve (IDC)
Individual demand curve shows the quantity of a good or service that an individual is willing to purchase at various market prices. Willingness to purchase decreases as price increase and vice versa so it slopes downward. It is mainly duet to two effects, substitution effect and income effect. When price of a particular good X increases (holding price of Y constant) consumers goes for its substitute Y and decreases the demand for X, it is substitution effect. Similarly, an increase in price of good X lowers purchasing power of the people, therefore its demand decreases due to decrease in real income, it is called income effect.
Aggregate Demand Curve (ADC)
Aggregate demand curve shows the relationship between the total quantity of real GDP demanded at various price levels, holding other things constant. Or Aggregate demand curve shows the level of total real GDP that households, firms, government and foreigners would be willing to purchase at different average price levels. The AD curve slopes downward which shows that people are willing to buy less goods and services at higher average price level and vice versa.
Difference Between IDC and ADC
AD curve looks like and individual demand curve but there are differences between them
- In individual demand curve we assume that prices of other related goods are constant, but we cannot do so in aggregate demand because here we are dealing with prices of all goods and services which are always changing.
- Individual demand curve slopes downward due to income and substitution effect. AD curve slopes down due to three reasons: the wealth effect, the interest rate effect and the net exports effect.
General Price Level
General price level or aggregate price level is a weighted average of prices for all goods and services in an economy. It is used to measure inflation. Common measures include the Consumer Price Index (CPI), Producer Price Index (PPI), and the GDP Deflator.
Suggestions for further readings
